See which sites need attention, at a glance.
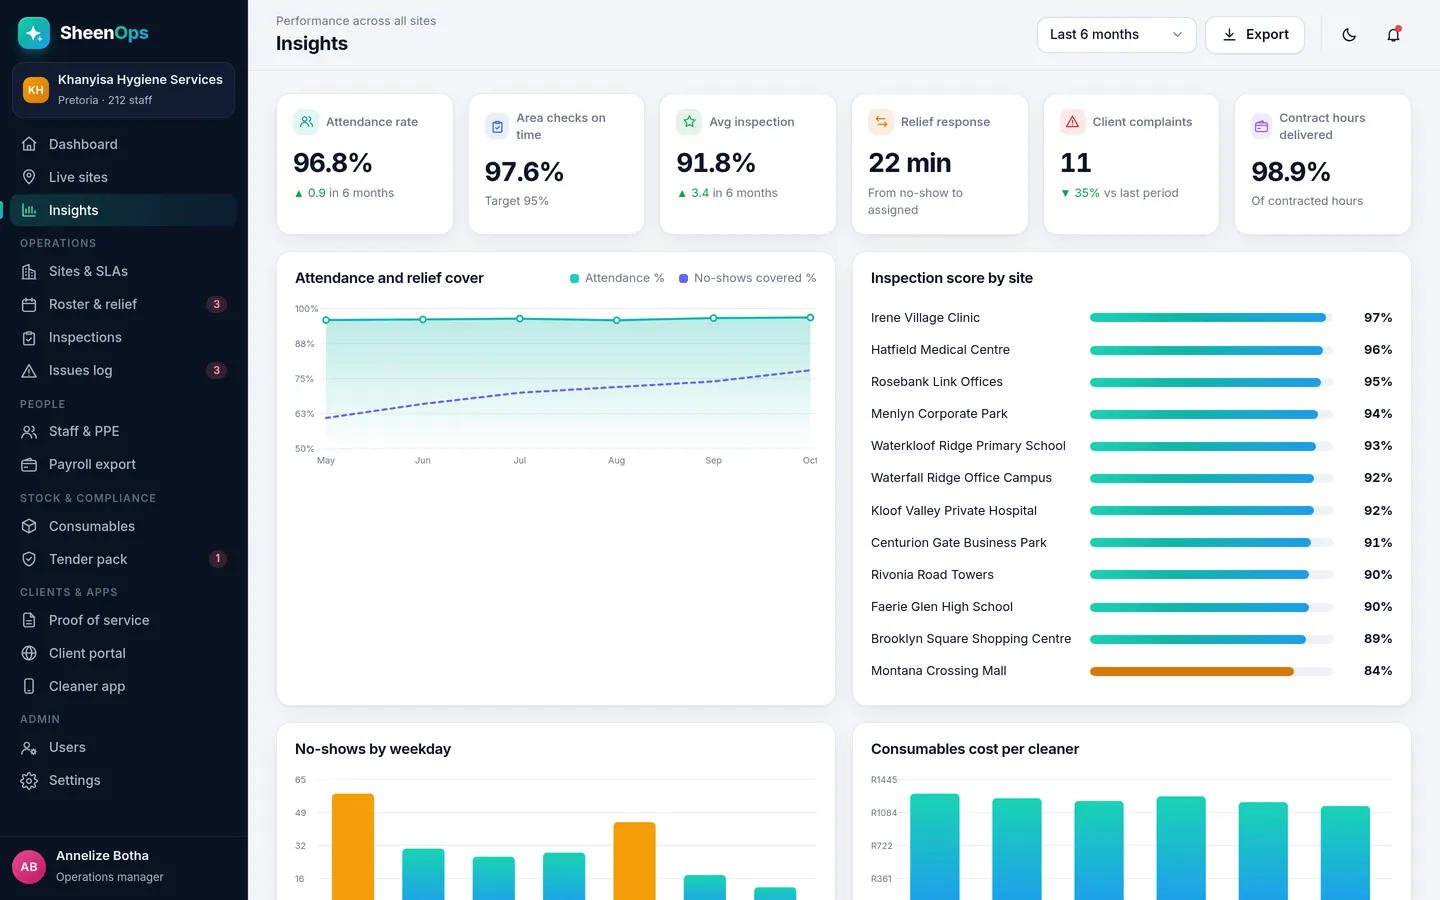
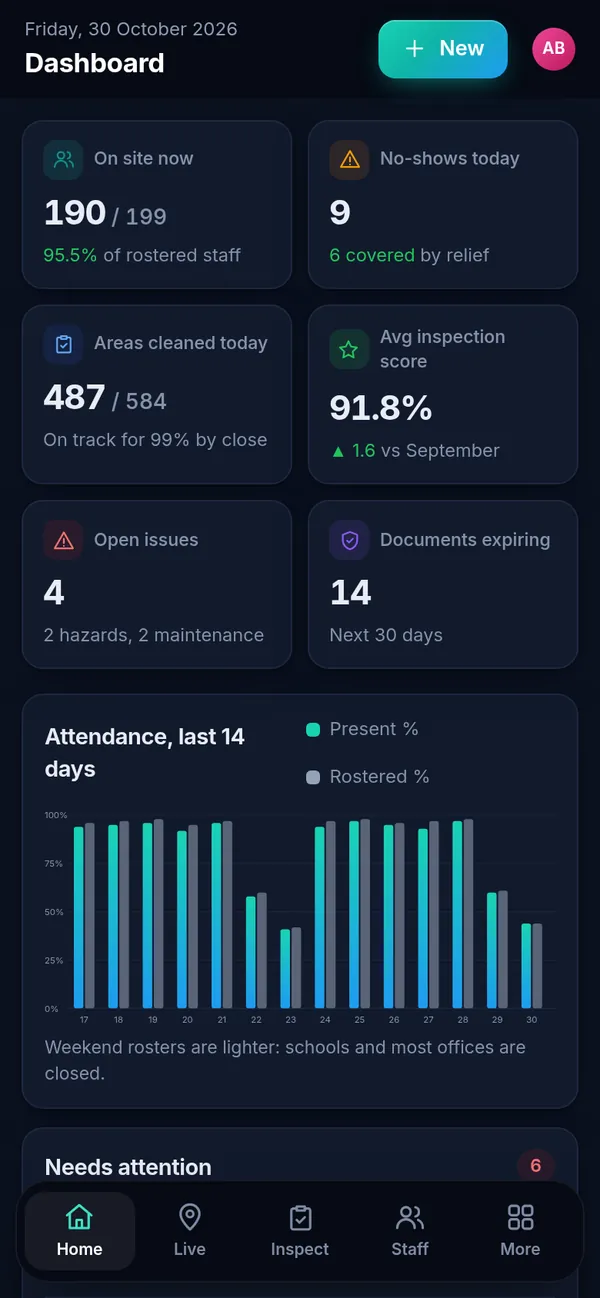
Simple dashboards show attendance trends, inspection scores by site, open issues and cost per site. You can see which contracts are doing well and which need a visit, without building a spreadsheet.
How it works, simply
The dashboard shows today's numbers: cleaners on site, no-shows covered, areas cleaned and the average inspection score. Insights goes further, with trends over months and a ranking of sites by score, so you can act before a contract is at risk.
What you get
- Attendance and inspection trends
- Sites ranked by score and SLA
- Issues by type and time to close
- Cost per site per month
Why it matters for your contracts
Cleaning contracts in South Africa are renewed on trust and lost on complaints. Insights turns the work your team already does into proof you can show the client, without extra admin for your supervisors.
It is one module of SheenOps. Use it on its own, or with gps & qr clock-in and client reports for the full picture.
Insights: questions
How much does SheenOps cost?
It depends on the modules you switch on and the size of your team. Ask for access to a working demo or WhatsApp us, and we will send you a quote that fits your company.
See SheenOps with your own sites
Ask for access to a working demo. We set it up with your sites and checklists, and give you a login to test it with your team. Or WhatsApp us with a text or voice note.